
![]()
How the pandemic affected unemployment by gender …
There’s a subject that is only now starting to be examined and reported in the media in earnest … how the pandemic has impacted the employment status of women.
The unemployment rate for women and men has basically been about the same for some time. Conveniently — for our purposes — in March 2020, which was prior to the pa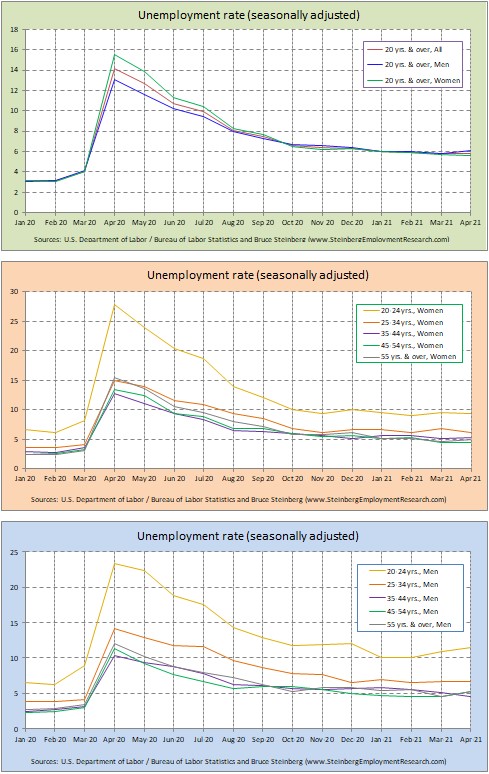 ndemic impacting employment, the unemployment rate was the same for men and women at 4.0 percent.
Although COVID-19 has been hard on all working people, women were and are more negatively affected.
The following month in April 2020 the overall unemployment rate rate skyrocketed to 14.2 percent with 15.5 percent for women and 13.0 percent for men. The difference between genders of 2.5 percentage points is not insignificant. There is no monolithic reason for the higher unemployment rate for women.
Regardless of gender or workforce politics, lower wage jobs are disproportionately held by women and lower wage jobs were and are disproportionately impacted by the pandemic. In addition, the childcare system and K-12 education — other than being disproportionately staffed by women — took a major hit from the pandemic that many believe are not able to accommodate the needs of working women, who — agree with it or not — are the major caregivers for children.
Breaking out unemployment rate by different age cohorts yields predictable results with younger persons taking the bigger hits regardless of gender on the job front likely because they are in lower wage jobs.
Although many smaller services businesses — think local restaurants (aren’t all restaurants basically local businesses?) as one example 00 have permanently closed, it will be some time before those jobs return and those businesses are reestablished.
In addition, forward-thinking businesses are taking advantage of the slowdown and trimmed down its workforce to automate processes where and when possible to be more productive. So even when activity returns to pre-pandemic levels, they will likely need fewer workers.
October 2020 Employment Report
Quick Recap
Employment and job numbers continue to improve in October but at an uneven rate.
The economy added a total of 638,000 nonfarm jobs in October, despite a big drop of 268,000 government jobs due to the discharging of Census 2020 temporary workers as well as declines in public education (more detail below). A year ago in October 2019, it added 185,000 jobs.
Average hourly wages were up four cents an hour in October. The previous month, they rose only one cent but in August they increased 10 cents from July.
And Temporary help services has now added jobs for the sixth consecutive month in October up five times its increase in September.
Job Report
The Bureau of Labor Statistics reports that the economy added 906,000 private-sector jobs in October that was slightly lower than the 892,000 gain of September; it increased 1,028,000 in August.
The private Goods-producing sector was up 123,000 in October, which was a nice improvement from the 97,000 added in September as well as the 53,000 increase of August.
-
Manufacturing was up 38,000 in October after adding 60,000 in September and increasing 30,000 in August.
-
The Construction sector was the big winner as it continued to build up its workforce with an increase of 84,000 in October on top of adding 35,000 jobs in September and gaining 24,000 in July.
-
And Mining and logging was able to add 1,000 jobs in October on top of the 2,000 it added in September after losing 1,000 in August.
The private Service-providing sector added 783,000 jobs in October that was slightly lower than the 795,000 it added in September but well off the 975,000 it added in August.
-
The Retail trade sector added 103,700 jobs in October, which was much greater than the 23,400 it added in September. It should be pointed out that September number was first reported last month by BLS as an increase of 142,400 — rarely are preliminary numbers revised by so much. Was this a “fat finger” error?
-
And the Wholesale trade sector continued to move forward but at a slower pace with an increase of 6,400 in October compared to the 18,900 gain in September.
-
Things picked up considerably in Transportation and warehousing with 63,200 more jobs in October compared to the 40,200 gain in September but off the 85,500 increase in August.
-
Financial activities slowed a bit with an increase of 31,000 in October that was off the 37,000 it added in September but still better than the 28,000 it added in August.
-
Growth for Professional and business services sector jobs improved with an increase of 208,000 in October that was much better than the 122,000 it added in September as well as the 184,000 it added in August. Computer systems design and related services was able to program in 15,800 more jobs in October compared to the 11,900 it added in September. Management and technical consulting services added 14,500 jobs in October and you don’t need an advance degree to know that was much better than the 5,900 it added in September. But Architectural and engineering services was only able to draw plans for 4,000 more jobs in October compared to the 13,500 it added in September.
-
The private Education and health services sector was up 57,000 in October — despite a decline in private Educational Services of 21,500, which had declined 69,100 in September. Growth in Home health care services slowed with an increase of only 3,700 in October after adding 16,400 in September.
-
The Leisure and hospitality sector grew by 271,000 in October that well off the pace after adding 406,000 in September.
The total number of Government jobs were down 268,000 in October. The federal government was down 138,000 almost all due to a decline in staffing for Census 2020, state government was down 65,000 mostly due to a decline in state government education jobs (down 61,400), and local government was also down 65,000, but all — and then some — due to a decline in local government education that declined by 97,800 while local government excluding education added 33,300 jobs.
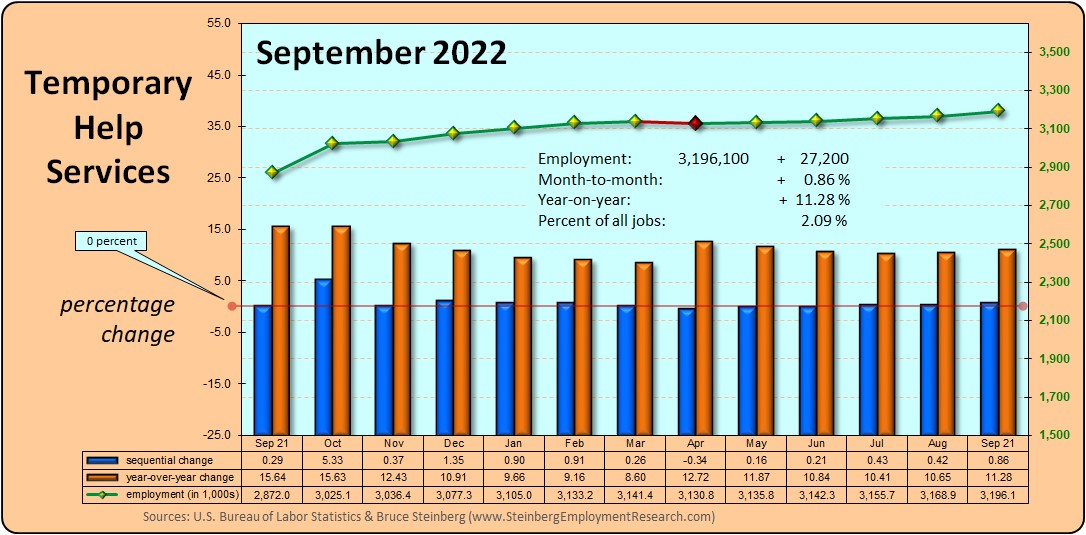
Temporary Help Services Roundup
Temporary Help Services continued to add jobs and at a faster pace with a gain of 108,700 jobs in October after adding only 21,800 in September. This brings the total number of THS jobs to 2,597,100, which works out to a healthy 4.4 percent sequential increase, but still down 11.8 percent from October 2019.
Note that Temporary Help Services has added almost 550,000 jobs since April when it plunged by 840,500 jobs from the previous month.
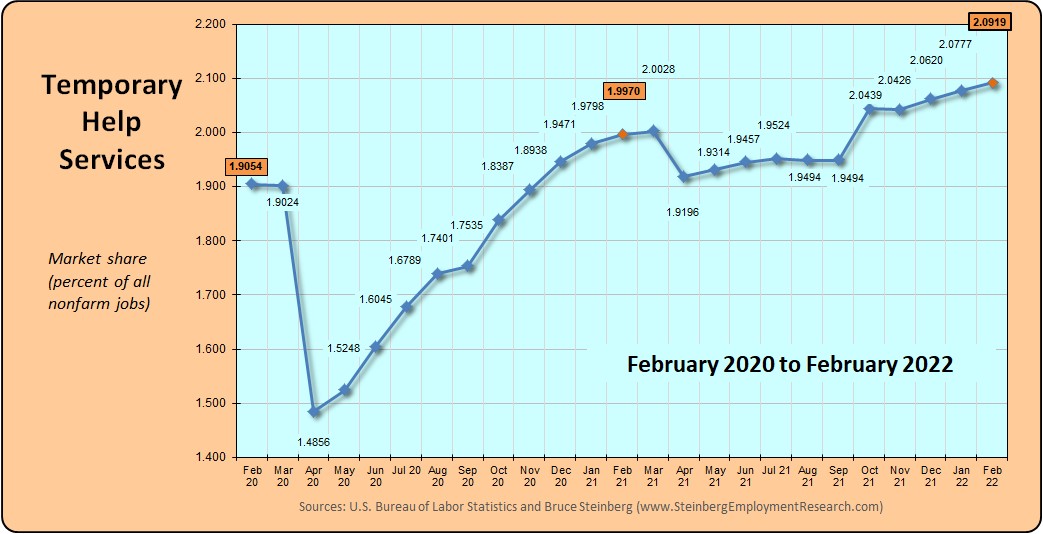
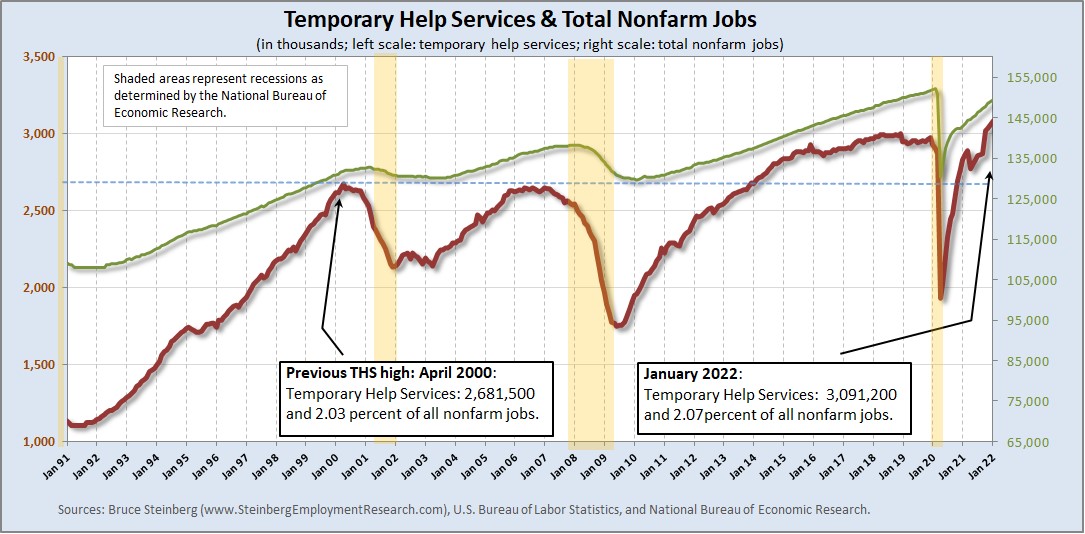
For a chart of temporary help’s growth from January 1991 to October 2020 and comparing its trend to total employment, click here.
(if the charts are unclear, click on it to open in a browser window)
In October 2020, temporary help services market share, which is its portion of all jobs, increased to 1.8242 percent down from 1.7557 the previous month. A year ago in October 2019 it was 1.9418 percent and two years ago in October 2018 it was 2.0014 percent.
Household Survey
Although BLS is still experiencing COVID-19 related errors with the data [emphasis is ours — ed.]. ” … analyses of the underlying data suggest there still may be some workers affected by the pandemic who should have been classified as unemployed on temporary layoff. However, the share of responses that may have been misclassified was highest in the early months of the pandemic and has been considerably lower in recent months.”
Officially, the unemployment rate in October was 6.9 percent and that is lower than the published September rate of 7.9 percent.
The number of employed persons increased 2,243,000 as the number of unemployed persons declined 1,519,000. The size of the entire labor force grew by 724,000 and there were 541,000 fewer people considered as not in the labor force in October.
The labor force participation rate increased 0.3 percentage points to 61.7 percent in October from September and the employment-to-population ratio was up 0.8 to 57.4 percent.
The number of discouraged workers is up from a year ago to 594,000 from 341,000 in October 2019.
BTW, we maintain an updated table of many major employment as well as other general economic indicators here or here for the mobile version.


