![]()
How jobs have returned … and how much further they have to go to get back to where they were …
We started this year with our report of the December 2020 employment situation looking at how some staffing-centric industries / sectors have recovered — or had started to recover — from the massive loss of jobs due to the pandemic. As we close out the year, we thought another follow-up to these trends are in order. Keep in mind that this section of our monthly employment report is prepared prior to the publication of the November employment and jobs data so this analysis runs to October.

[Note: depending upon how well your browser and / or email program renders this chart, it may be difficult to view; we suggest you click on it to open a larger version.]
Total nonfarm jobs were down only 2.9 percent from its peak but up 14.0 percent trough by October 2021. Private-sector jobs trended similarly and 2.5 percent from its peak and up 16.7 percent from its trough.
All but one of the limited sectors examined were still down in October 2021 from their respective peaks of February 2020 sans one — computer systems design and related services is up 50,600 jobs, or 2.3 percent.
Food services and drinking places were the hardest hit by the pandemic in terms of the number of jobs that declined nearly fifty percent from peak to trough and was still down 6.4 percent, or around 784,000 jobs, in October 2021 from its February 2020 peak but is up 82.0 percent from its April 2020 trough.
Clearly, temporary help services was hit very hard in April 2020 with a 33.9 percent decline from its peak two months earlier in February 2020, and by October 2021 it was up 42.4 percent from its April 2020 trough. But temporary help services was still down 5.9 percent in October 2021 from its February 2020 peak, so there appears to still have some room to grow.
Workers on temporary layoffs or permanently lost their jobs have still not returned to pre-pandemic levels …
Although the first affect of the pandemic on the employment and jobs data may had first been seen in March 2020, the major impact did not occur until the following month. This is because the survey week is mid-month.
 Regardless, the pre-pandemic levels of these two metrics have pretty much returned to their pre-pandemic relationship, but not levels.
For the past six months (May to October 2021), the average number of workers on temporary layoffs was almost 1,384,000 and those who report they permanently lost their jobs was just a little greater than 2,702,000. For the same six-month time period in pre-pandemic 2019, just over 830,000 workers said they were on temporary layoff and 1,303,000 said they permanently lost their job.
Interestingly, the ratio between these two sets of workers — and it should point out that these statuses are self-reported so those who report they were on temporary layoff may have, in reality, been permanently laid off or vice-a-versa, which is why we used the words “report” and “said” — was 1.6 in 2019 meaning for every one workers on temporary layoff, there were 1.6 who permanently lost their job; By October 2021, the ratio had risen to 2.0. A preliminary conclusion is that employers are lowering their permanent staffing levels and the reasons for that development are numerous — more numerous than will be addressed here.
November 2021 Employment Report
Quick recap
The unemployment rate plummeted — yes, we said plummeted — 0.4 percent to 4.2 percent in November. However, the number of nonfarm jobs for the past several months was up only 210,000 in November, which was below consensus expectations as well as October’s gain of 546,000.
Average hourly wages were up eight cents in November, which was a 0.3 percent increase; in the last 12 months, hourly wages are up 4.8 percent.
Temporary Help Services experienced only a moderate increase in November but October was stronger by about ten percent than previously reported.
Jobs Report
Private sector employers added 235,000 jobs in November and that was much weaker than the 628,000 growth in October as well as the increase of 424,000 in September; a year ago in November 2020, the private sector added 359,000 jobs.
The private Goods-producing sector added 60,000 jobs in November after gaining 94,000 in October and 65,000 in September.
- Manufacturing continued to improve with an increase of 31,000 in November that was lower than the 48,000 it added in October but slightly better than the 29,000 increased of September.
- The Construction sector growth also added 31,000 jobs in November after adding 43,000 in September and increasing 35,000 in September.
- Mining and logging continued lost a little ground with a decline of 2,000 in November that followed the addition of 3,000 in October and increase 1,000 in September.
The private Service-providing sector was up only 175,000 jobs in November after adding 534,000 in October and growing by 359,000 in September; a year ago in November 2020, it was up 291,000 jobs.
- The Retail trade sector removed 20,400 from its job inventory in November after adding 37,800 in October and a similar gain of 39,100 in September; a year ago in November 2020, this sector cut 2,100 jobs..
- Hiring slowed in the Wholesale trade sector that increased 8,000 in November after adding 12,500 in October and adding 9,900 in September.
- Transportation and warehousing continued to add jobs with an increase of 49,700 in November that was off the gain of 59,800 in October but further off the 63,400 increase of September; a year ago in November 2020 ,it was up 123,600.
- Financial activities experienced a 50 percent reduction in its job gains with an increase of only 13,000 in November compared to the addition on 26,000 in October but similar to the 12,000 it added in September; a year ago in November 2020, it was up an even 10,000.
- The Professional and business services sector added 90,000 in November that followed a gain of 121,000 in October and an increase of 111,000 in September; a year ago in November 2020, it was up 95,000. Computer systems design and related services computed in 9,500 more jobs in November after adding 11,400 in October. Management and technical consulting services added 12,000 in November that followed an increase of 20,900 in October. Architectural and engineering services gained only 2,000 jobs in November, which followed a 2,800 increase in October; it will be interesting to watch how employment changes in this sector as the infrastructure bill starts to work its way into practice.
- The entire private Education and health services sector was up only 4,000 in November after adding 59,000 in October. Home health care services essentially flatlined with a marginal decline of only 300 jobs in November after 19,300 in October.
- The entire Leisure and hospitality sector was up 23,000 in November after adding 170,000 in October.
The total number of Government jobs declined by 25,000. The Federal government was up 2,000 in November. State government declined by a total of 9,000 with some, but not all, of that decline in state education while local government declined a total of 18,000 jobs with a majority of the decline in local education.
Temporary Help Services Roundup
Temporary Help Services appears to be on a consistent, but decelerating, trend but with a gain of only 6,200 jobs in November, which was a meager 0.2 percent increase form October, but up a respectable 9.1 percent from a year earlier. Revised data show that the sector added 46,400 in October and 14,900 in September; a year earlier in November 2020, it increased 39,000.
For a chart of THS jobs compared to all nonfarm jobs, click here.
(if charts are unclear, click on it to open in a browser window)
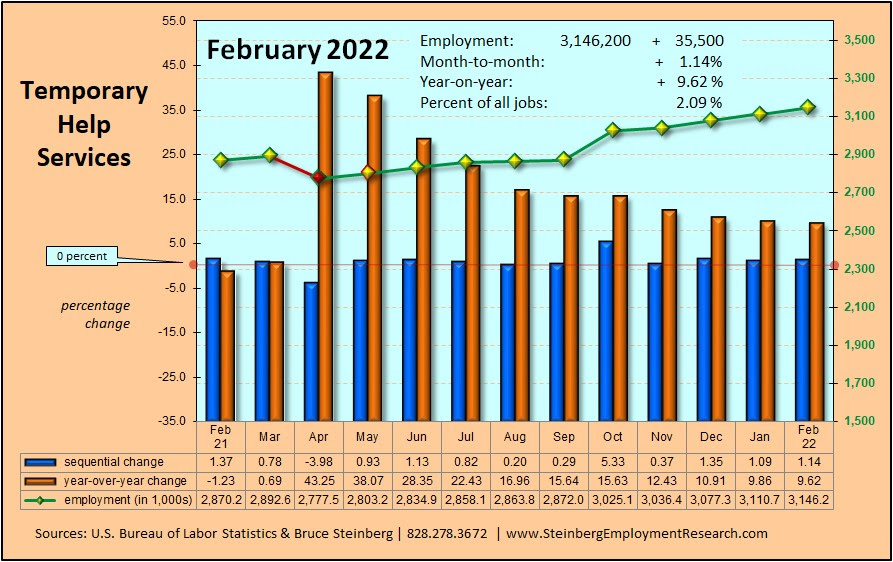
In November 2021, temporary help services market share, or its portion of all jobs, was 1.8786 percent up from 1.8771 the previous month. A year ago in November 2020 it was 1.7916 percent but two years ago in November 2019 it was 1.9420 percent.

Household Survey
The unemployment rate fell 0.4 percent to 4.2 percent in November.
The labor force grew by 594,000 while there were 1,136,000 more employed persons, and 542,000 fewer unemployed persons. In addition, the workforce participation rate increased 0.2 to 61.8 percent and the employment-population ratio jumped 0.4 to 59.2. Those considered as not in the labor force declined by 473,000. We cannot help but speculate could the ending of the enhanced unemployment benefits have moved people off their couches and into the workplace? BTW, the number of people filing for unemployment benefits for the first time last week was at a lower level than before the pandemic. For a chart of this, click on my Twitter.
BTW, we maintain an updated table of many major employment as well as other general economic indicators here or here for the mobile version.