
![]()
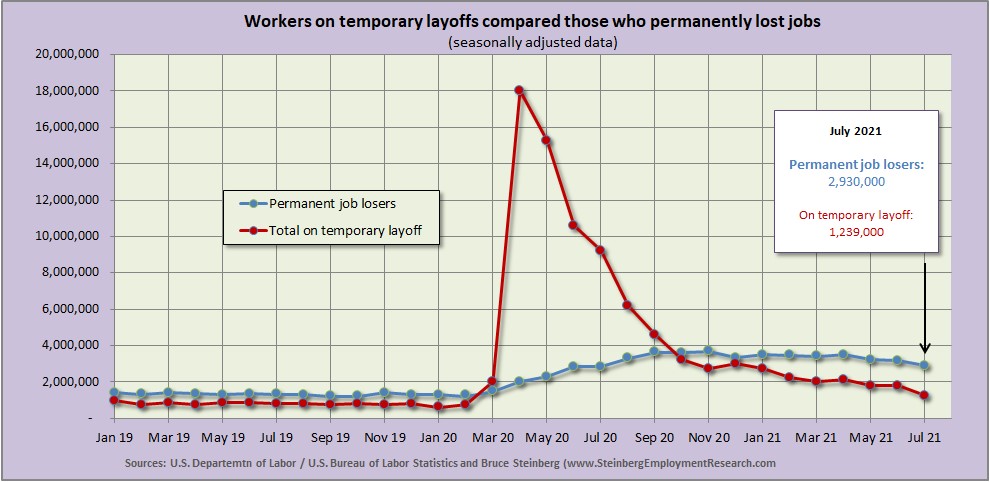
Another way to look at those who are on temporary layoffs compared to permanent job losers.
Several times during our pandemic-related analyses, we examined the different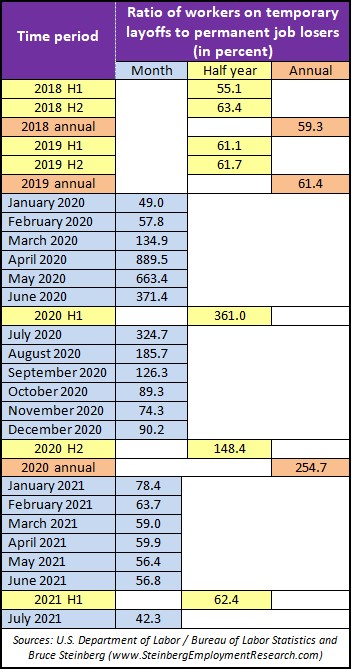 trends with those on temporary layoffs and those who permanently lost their jobs. More importantly, how are they changing.
This month instead of emphasizing the actually numbers of workers in each of these cohorts, we take a deeper dive into the ratio between them expressed as a percentage. It may be helpful to review the actual meaning of “percent” … and we do not have to go any further than reminding it is a ration of the “portion of one hundred.”
Pre-pandemic the number of workers on temporary layoff was about 60 percent of those who permanently lost their jobs; in other words, there were 60 workers on temporary layoff for every 100 who permanently lost their jobs. Reduce it down and it works out to three workers on temporary layoff for every five who lost their job permanently.
During the initial impact of the pandemic on the employment economy, the situation reversed — and very abruptly and by a large amount. In April 2020, there were almost 890 workers on temporary layoffs for every 100 who permanently lost their jobs. Reduce and round it down further, there were almost nine workers on temporary layoff for every single worker who permanently lost a job.
As we have pointed out before, it is important to keep in mind that these data are self-reported so it is not really known if people were really on temporary layoff or it was just wishful thinking or employers were not being honest, or possibly knowing, and dangled the prospect that furloughed workers will be the first to be rehired. In addition, the Paycheck Protection Program — a.k.a. PPP loans — that subsidized firms to keep laid-off personnel on their payrolls possibly encouraged some employers to report as “temporarily” laid-off employees that realistically had no chance of being brought back.
The ratio began to return to normal — or the pre-pandemic ratio — this year and only slightly above the pre-pandemic level in H1 2021 at 62.4 percent.
Much as been reported — and essentially correctly — that the pandemic had a disproportionate impact on lower-wage, lower-skilled service jobs and did not have such a large affect on higher-wage, higher-skilled professional jobs.
But in July — the latest figures available at this time — the ratio plunged to 42.3 percent. likely an indication that many of the jobs that were lost to the pandemic are returning and remain in the employment economy.
So if many of the people who lost jobs during the pandemic are coming back, why is the widespread labor shortage persisting?
Keep in mind that this information is just from people who lost jobs — and for those who are currently losing jobs, although there is a declining number of than them, also feel that their personal job loss is not temporary.
August 2021 Employment Report
Quick recap
Although the unemployment rate dropped 0.2 percent to 5.2 percent in August, the total number of nonfarm jobs increased only 236,000 after expanding by 1,053,000 in July and growing 962,000 in June. We offer an explanation of the August decline in the unemployment rate within an environment of relatively weak overall job growth in the Household Survey section, which is at the end of this section.
Average hourly wages were up 17 cents in August after rising 12 cents in July. The average workweek for private, nonfarm employees was unchanged at 34.7 hours. The average workweek in manufacturing declined by 0.2 hour to 40.3 hours and overtime was unchanged at 3.2 hours.
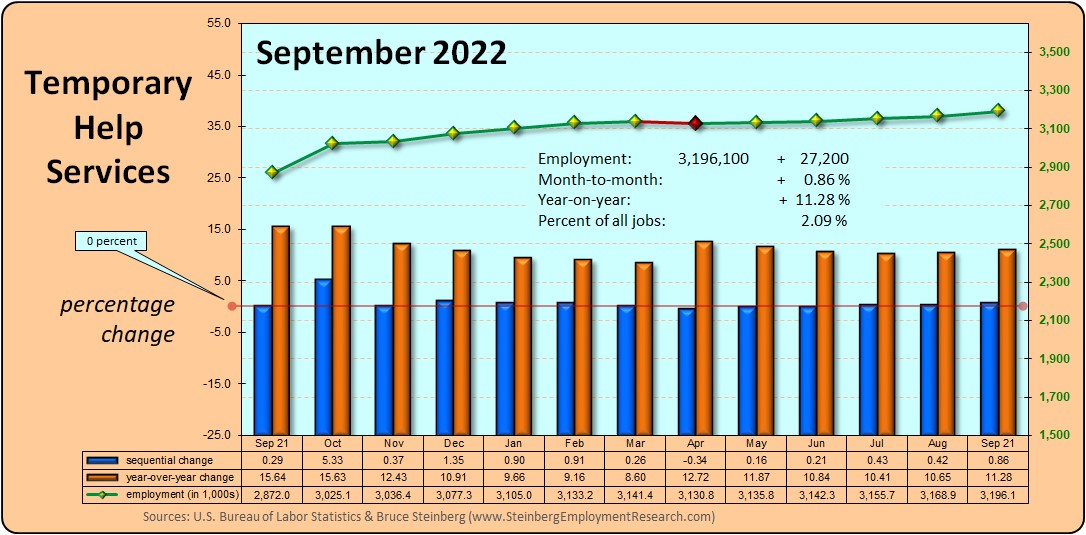
After three consecutive months of increases, Temporary Help Services slightly retreated.
Jobs Report
Private sector employers added only 243,000 jobs in August compared to the July increase of 798,000; a year ago, this metric was up 1,066,000 in August 2020 from the previous month.
The private Goods-producing sector added 40,000 jobs in August after adding 64,000 in July and was up 42,000 in June.
-
Manufacturing continued to improve with an increase of 37,000 in August albeit at a slower pace compared to the 52,000 it added in July.
-
The Construction sector did a little demolition in August with a decline of 3,000 after adding 6,000 in July.
-
Mining and logging was steady with the addition of 6,000 jobs in August, which was the same amount it added in July.
The Service-providing sector that added 203,000 jobs in August, which was a disappointment after increasing by 734,000 in July and adding 766,000 in June.
-
The Retail trade sector continued to process returns with a decline of 28,500 in August that followed a decline of 8,000 in July.
-
The Wholesale trade sector increased only 1,400 in August after adding 13,600 in July, which was revised upward by more than 10,000.
-
Transportation and warehousing continued to hold at a steady speed with the addition of 53,200 jobs in August after adding 55,000 in July.
-
Financial activities seemed to maintain an interest in hiring with 16,000 more jobs in August that followed an increase of 24,000 in July.
-
The Professional and business services sector added 74,000 jobs in August after adding 79,000 in July. Computer systems design and related services calculated 9,800 more jobs in August after adding 7,400 in July. Management and technical consulting services added 7,000 in August that followed an increase of 7,700 in July. Architectural and engineering services really went on a hiring spree with an increase of 18,700 in August after adding 4,300 in July.
-
The entire private Education and health services sector added 35,000 in August on top of 88,000 in July. Home health care services declined by 11,600 in August, which is a relatively large number especially when comparing to the decrease of only 600 in July.
-
The entire Leisure and hospitality sector was flat in August after adding 415,000 in July. Although its Arts, entertainment, and recreation sub-sector added 35,000 jobs in August, the Accommodation and food services sub-sector declined by a similar amount.
The total number of Government jobs declined by 8,000 in August The Federal government added 3,000 in August. State government declined 25,000 mainly, but not limited to a decline in state government education, while Local government was up 14,000 despite a 5,700 decline in local government education.
Temporary Help Services Roundup
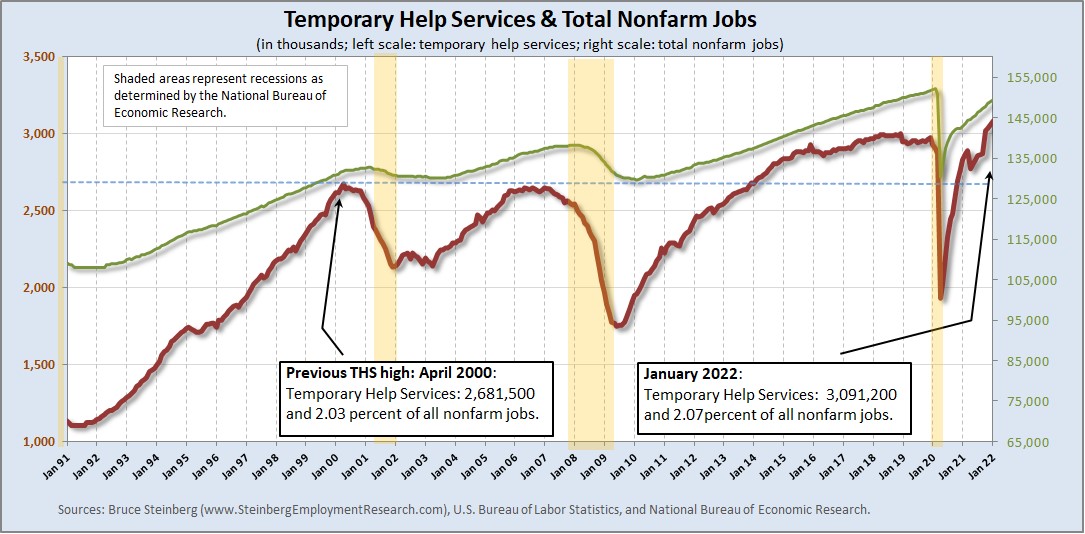
Although the expression that “what goes up, must come down” may no longer be true with today’s advancement in space exploration, it does apply to Temporary Help Services. With a decline of 5,800 jobs, the total number of THS jobs in August 2021 was 2,682,600, or a 0.2 percent sequential decline. But, like the Schroeder’s cat thought experiment, which in my opinion is really more of a paradox, it also grew at the same time by increasing 12.7 percent from August 2020.
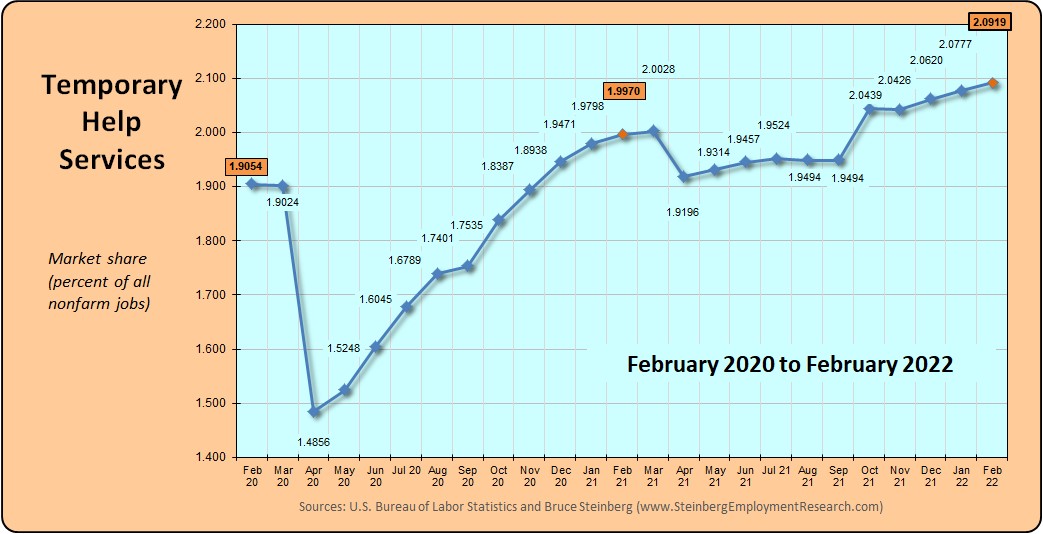
For a chart of THS jobs compared to all nonfarm jobs, click here.
(if the charts are unclear, click on it to open in a browser window)
In August 2021, temporary help services market share, which is its portion of all jobs, was 1.8225 percent down from 1.8294 the previous month. A year ago in August 2020 it was 1.6862 percent but two years ago in August 2019 it was 1.9490 percent.
Household Survey
The unemployment rate declined percent to 5.2 percent in August 2021 because more people were employed and fewer people were unemployed and while the entire labor forced grew, it was by a relatively small number.
The labor force expanded by only 190,000, there were 509,000 more employed persons, and 318,000 fewer unemployed persons. The workforce participation rate was unchanged at 61.7 percent and the employment-population ratio moved up 0.1 to 58.5. Those considered as not in the labor force declined by 49,000. So, with more people employed and fewer people unemployed, because the labor force did not expand by a lot, the unemployment rate declined despite weak, overall job growth.
BTW, we maintain an updated table of many major employment as well as other general economic indicators here or here for the mobile version.


