
![]()
Are you targeting the right sectors?
 How the pandemic has affected new business formation is another interesting trend to examine. New businesses can often translate into renewed opportunities for suppliers to those new businesses as well as present more sales for staffing companies.
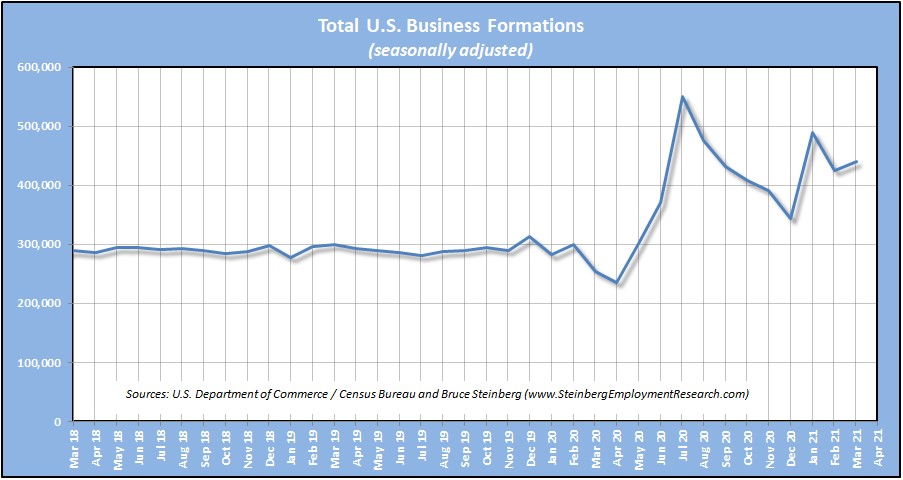
For two years prior to the pandemic, the average number of business formations was just under 300,000 per month, ranging from almost 17,600 more in February 2019 than the previous month to just under 30,300 fewer in January 2020.
Between February 2018 and January 2020 inclusive there were only a little less than 670 new business formations per month on average.
But in April 2020, the month after the pandemic was firmly established in the United States, there were almost 61,900 fewer new business formations compared to just two months earlier in .February 2020. From that nadir in April 2020 of only 236,500 new formations, it jumped only three months later to a zenith of 551,660 in July 2020 to a zenith.
And although the month-over-month changes continue to bounce around a lot, from May 2020 to February 2021 inclusive, there was an average of almost 418,800 new business formations per month.
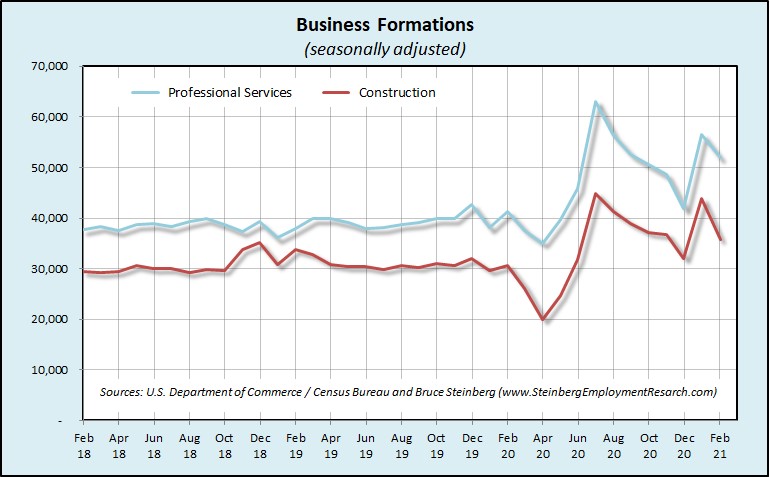
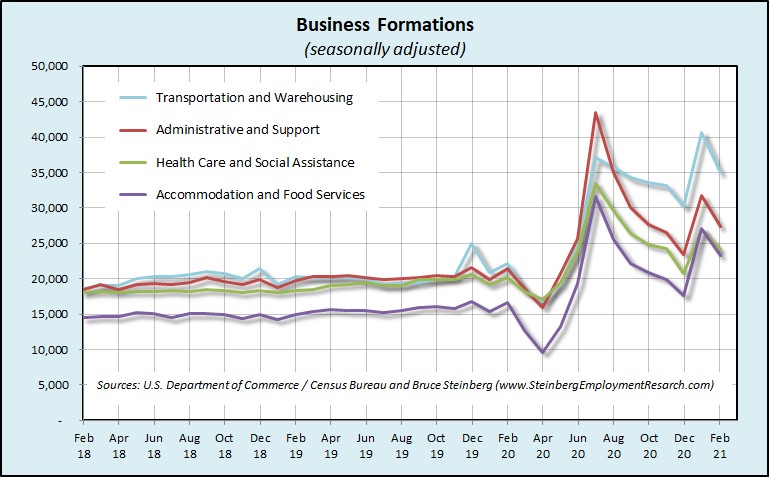
The same basic trend of reaching a low point in April 2020, shooting up in July 2020, and then bouncing around a lot but generally declining but still at a higher level in February 2021 than the two-year pre-pandemic average is seen in most major sectors.
[The various sectors in the multiple sector charts were grouped together solely based by the number of new business formations and not by any similarly between the sectors. This was done because the trend lines would not be clearly delineated since the number of formations varied greatly among sectors.]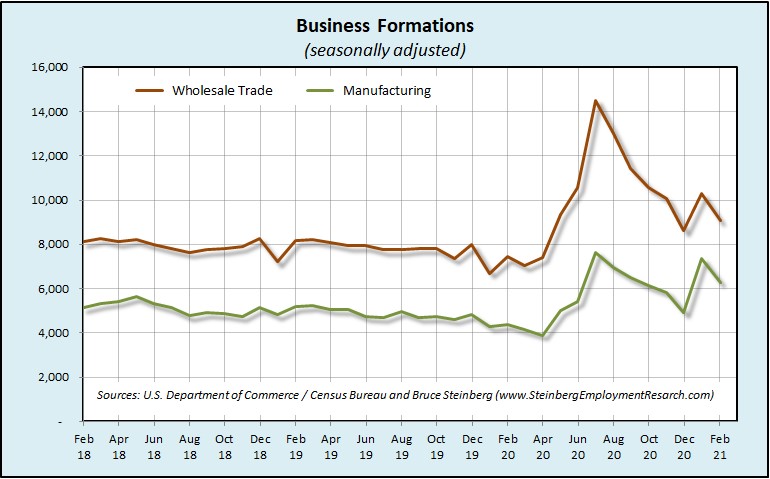
March 2021 Employment Report
Quick recap
The employment economy continues to recover with a gain of 916,000 nonfarm jobs in March that was almost double its growth the previous month of February. A year ago in March 2020 the economy lost 1,683,000 jobs and that was just a small foreshadowing of what was to come the next month.
The unemployment rate improved to 6.0 percent in March from February’s 6.2 percent; a year ago in March 2020 it was 4.4 percent as the pandemic just started to hit the the nation’s employment situation.
Average hourly wages were down four cents in March after rising eight cents in February likely due to the return of large numbers of lower-skilled, and hence lower-wage, jobs. In Bureau of Labor Statistics government-speak, “The large employment fluctuations over the past year — especially in industries with lower-paid workers — complicate the analysis of recent trends in average hourly earnings.”
But Temporary help services, after posting steady gains for many months, was essentially unchanged with a sequential loss of less than 1,000 jobs.
Jobs Report
The Bureau of Labor Statistics reports that the economy added 780,000 private-sector jobs in March after increasing by 558,000 in February. Considering the pandemic was just beginning to affect the employment and jobs data a year ago in March 2020, year-over-year comparisons would be quite misleading.
The private Goods-producing sector added an extraordinary 183,000 jobs in March after contracting by 44,000 in February.
- Manufacturing assembled 53,000 more jobs in March that followed bolting on 18,000 more in February.
- The Construction sector added a few more floors of workers with the addition of 110,000 more jobs in March after removing 56,000 in February that was due — either in part or totally — to the weather.
- And Mining and logging was able to bring 20,000 more jobs to the surface in March after cutting down 6,000 in February.
The private Service-providing sector continued to post some big numbers with the addition of 597,000 more jobs in March after increasing by a similar 602,000 in February.
- The Retail trade sector was again uncharacteristically steady in March with a gain of 22,500 jobs after adding 28,000 in February.
- The Wholesale trade sector picked up some steam with a gain of 23,700 jobs in March after adding only 6,200 in February.
- And growth also accelerated in Transportation and warehousing with a gain of 47,500 in March after a strong February performance of an increase of 35,500.
- Financial activities was able to change its debit of 9,000 jobs of February to a gain of 16,000 in March.
- Professional and business services sector continued to slow its roll a bit with an increase of 66,000 jobs in March that followed a gain of 78,000 in February and after adding 90,000 in January. Computer systems design and related services continue to improve with the addition of 5,500 jobs in March albeit at a slower pace compared to the 8,900 it added in February. However, Management and technical consulting services got back on track with the addition of 7,600 on March after increasing 3,300 in February. Architectural and engineering services more than doubled its jobs portfolio with 7,400 more jobs in March after adding 3,500 in February.
- The entire private Education and health services sector added 101,000 in March. Home health care services continued its recovery but at a slower pace with 4,200 more jobs in March than February when it added 6,000.
- The Leisure and hospitality sector’s rollercoaster continue to gain altitude with a gain of 280,000 jobs in March after adding 384,000 in February.
The total number of Government jobs was up 136,000 in March. The Federal government was up 7,000 jobs. After State and Local governments saw declines in February mainly attributable to losses of education jobs, State government was up a total of 46,000 and Local government was up 83,000 mainly due to increases in education in both.
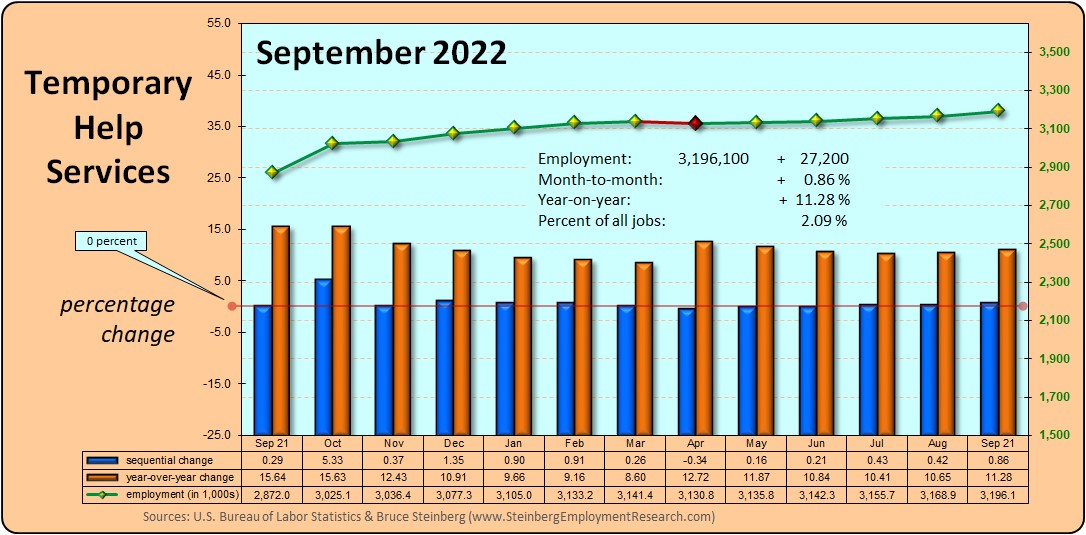
Temporary Help Services Roundup
Temporary Help Services, with a total of 2,769,300 jobs in March, apparently took a breather with an essentially flat performance with a decline of 800 jobs, or down 0.03 percent from February. Year-over-year performance continued to improve, but still in negative territory with a year-over-year decline of “only” 4.3 percent from March 2020. Could temporary help services be suffering from a similar malaise as the housing market, which is suffering from a shortage of inventory, with a shortage of available of workers?
(if the charts are unclear, click on it to open in a browser window)
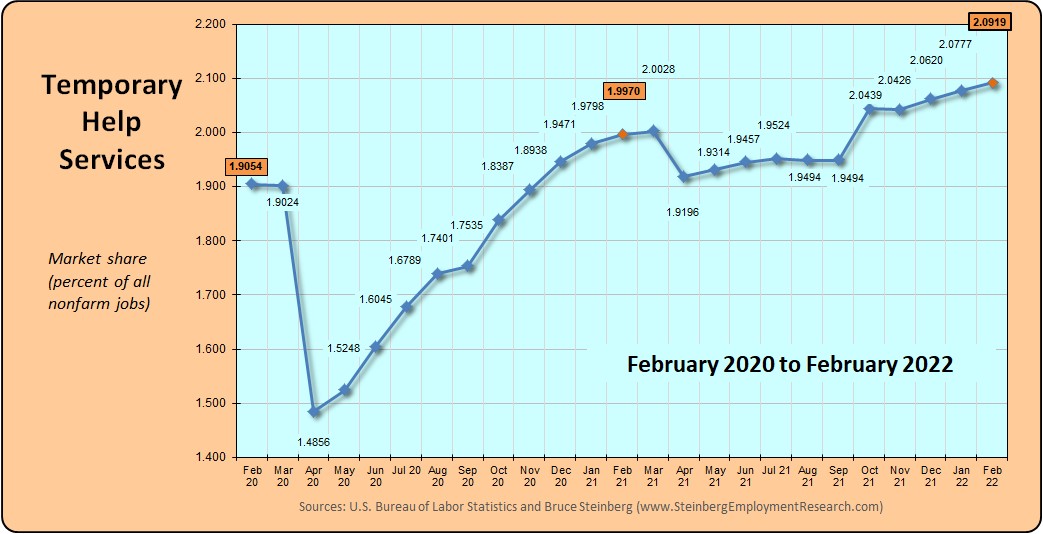
In March 2021, temporary help services market share, which is its portion of all jobs, dipped to 1.9215 percent down from 1.9344 the previous month. A year ago in March 2020 it was 1.9189 percent and two years ago in March 2019 it was 1.9648 percent.
Household Survey
The unemployment rate continued to decline and was 6.0 percent in March compared to 6.2 percent in February.
The labor force grew by 347,000 in March and there were 609,000 more employed persons and 262,000 fewer unemployed persons. The workforce participation rate bumped up 0.1 percentage point to 61.5 percent while the employment-population ratio ticked up 0.2 percentage points to 57.8. Those considered as not in the labor force declined by 263,000.Simply stated, more people are returning to the workforce and to jobs.
BTW, we maintain an updated table of many major employment as well as other general economic indicators here or here for the mobile version.