How jobs have returned … and how much further they need to go to return to where they were …
Let’s start out my wishing everyone a Happy New Year and hoping 2021 is better than last year. Instead of sending an e-card to everyone — and we surmise some of you would have no interest and that email would just be cluttering up your inbox, which you may have resolved to keep less cluttered in 2021 — if you would like to see my personal holiday greeting card, click here.
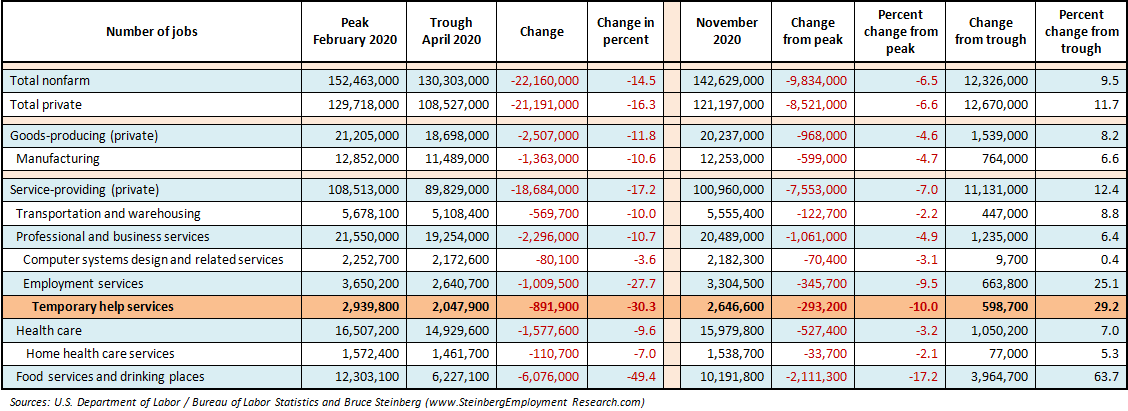
Now, to get down to business. We thought it would be interesting to see how some industries / sectors have recovered — or have started to recover — from the the loss of jobs due to the pandemic. Because this analysis was prepared earlier this week before the December 2020 employment situation was released, we only have examined the 2020 jobs data to November 2020. The peak in 2020 for jobs was in February and troughed two months later in April.
Total nonfarm jobs dropped 14.5 percent to its trough in April from its peak in February and still down 6.5 percent from its peak but up 9.5 percent from its trough. Private-sector jobs performed similarly. And the changes for most industries and sectors followed the same basic trends.
We won’t go through each of the sectors or subsectors that are presented in the table — you can see that for yourselves in the chart — but will highlight some specifics for the outliers to the overall job trends.
It should come as no surprise that jobs in food services and drinking places — more commonly referred to as restaurants and bars — plummeted 41.4 percent in April and was still down 17.2 percent from its peak despite being up 63.7 percent from its trough.
On the other end of the spectrum, computer systems design and related services, which only dropped 3.6 percent to its trough and was still only down 3.1 percent from its peak, is only up 0.4 percent from its trough.
And temporary help services that had experienced a lot of pain and dropped 30.3 percent into its trough and was still down 10.0 percent in November from its peak, is up a healthy 29.1 percent from its trough.
The employment situation is either on the mend or still has a long way to go depending upon one’s point of view — sort of a glass half-full / half-empty thing. If you find this information interesting and helpful and would like to see similar data for other industries / sectors, let us know and we may just address it in the future.
December 2020 Employment Report
Quick Recap
Job growth had slowed considerably in November and reversed direction with a decline in December as the unemployment rate was unchanged.
The economy declined by a total of 140,000 nonfarm jobs after adding 336,000 in November, and increasing 654,000 in October; a year ago in December 2019, it was up 184,000 jobs. The December declines were concentrated in, but not limited to, two private-sector service sectors.
The unemployment rate was unchanged 6.7 percent, with relatively small changes in its underlying components.
Average hourly wages were up 23 cents an hour in December compared to a nine-cent bump up in November that followed a two-cent rise in October. Is this an early sign of inflation?
And Temporary help services has now added jobs for the eighth consecutive month in December at a much better rate than in the previous month.
Job Report
The Bureau of Labor Statistics reports that the economy declined — yes, declined — by 95,000 private-sector jobs in December. In November it added 417,000, was up 925,000 in October; a year ago it rose 164,000 in December 2019.
The private Goods-producing sector was up 96,000 in December, which was better than 67,000 gain seen in November but less than the 117,000 increase of October.
-
Manufacturing was up 38,000 in December that was only slightly higher than the 35,000 increase in November but somewhat off the 43,000 increase in October.
-
The Construction sector gained 51,000 jobs in December and that was better than the increase of 29,000 in November but clearly off the 72,000 it added in October.
-
And Mining and logging was up 4,000 jobs in December after adding 3,000 jobs in November that followed a 2,000 job gain in October.
The private Service-providing sector declined by 188,000 jobs in December after adding 350,000 in November and gaining 808,000 in October; a year ago in December 2019, it increased by 159,000. As mentioned earlier, the December declines were concentrated in two private service-producing sectors.
-
The Retail trade sector continued to be very uneven in its staffing with an increase of 120,500 in December after contracting by 21,200 in November.
-
But the Wholesale trade sector continued to move steadily forward with the addition of 25,100 in December, up 11,800 in November, and gaining 8,700 in October.
-
Hiring continued but slowed considerably in Transportation and warehousing with an increase of 46,600 in December after adding 128,000 in November, which was about double the 65,800 it added in October.
-
Financial activities growth continued at a fairly steady pace with 12,000 more jobs in December than November when it added 16,000 but considerably slower than the gain of 30,000 in October.
-
The Professional and business services sector jobs picked up the pace with the addition of 161,000 jobs in December that was much better than the 88,000 it added in November, but weaker than the 245,000 it increased by in October.. Computer systems design and related services bounced back with 20,300 more jobs in December after declining by 5,000 in November. Management and technical consulting services also picked up the pace with the addition of 9,200 jobs in December after adding 1,400 in November. Architectural and engineering services managed to assembled 4,400 more jobs in December than November when it added 5,900 jobs.
-
The entire private Education and health services sector contracted by 31,000 in December due to a loss of 62,500 private educational services jobs. Home health care services added only 1,500 jobs in December that was off the pace of the 12,800 it added in November.
-
The Leisure and hospitality sector was down a total of 498,000 jobs in December with a subsector — Food services and drinking places — off 395,600.
The total number of Government jobs was down 45,000 in December. The Federal government was up 6,000 jobs; state government was down 19,000 due to a decline of almost 20,000 in state government education, and local government was down a total of 32,000 with almost all of the decline in local government education.
Temporary Help Services Roundup
Temporary Help Services continued to add jobs and picked up the pace with an increase of 67,600 more jobs in December than November when it added 41,800. This brings the total number of THS jobs to 2,726,300, which works out to a 2.5 percent sequential increase, but still down 7.6 percent from December 2019.
Note that Temporary Help Services has added almost 680,000 jobs since April when it plunged by 840,500 jobs from March.
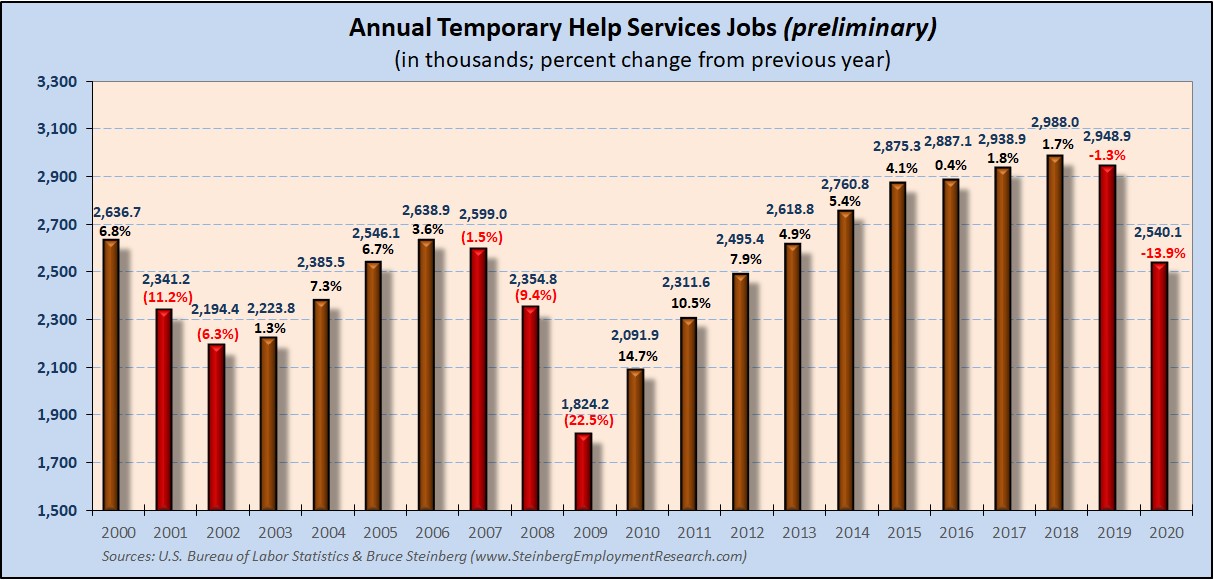
Although the jobs data for 2020 officially is considered preliminary and will be marked as final with next month’s data release, it normally doesn’t change too radically. To say that 2020 was a down year would certainly not be inaccurate and looks to be about a 14 percent decline from 2019, which was an off year as well, but by only 1.3 percent. For a chart of temporary help’s growth from January 1991 to December 2020 and comparing its trend to total employment, click here.
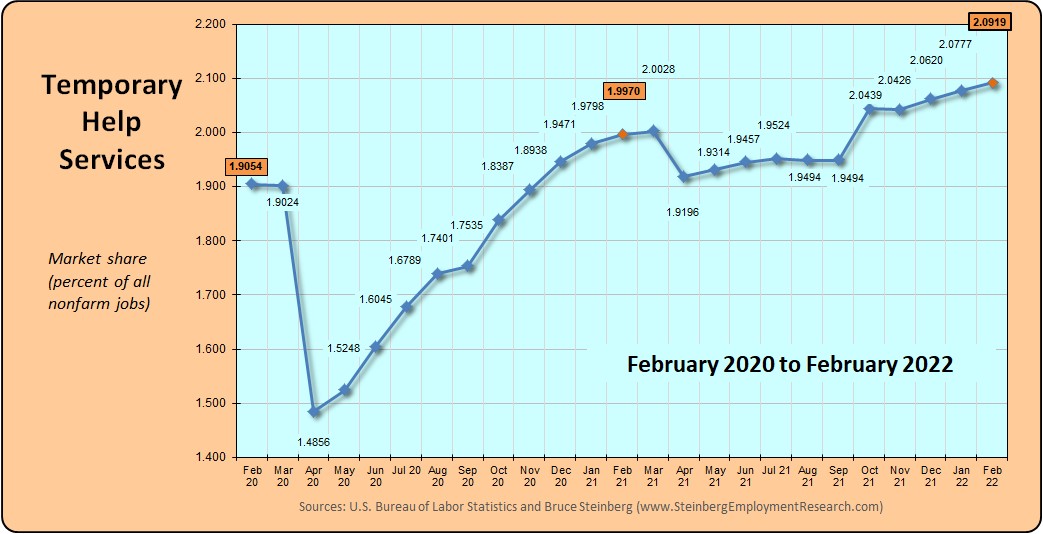
In December 2020, temporary help services market share, which is its portion of all jobs, increased to 1.9115 percent up from 1.8623 the previous month. A year ago in December 2019 it was 1.9408 percent and two years ago in December 2018 it was 1.9971 percent.
Household Survey
Although BLS is still stating there are errors with the unemployment data mainly because of persons misclassifying themselves as on temporary layoff when they should be identified as unemployed. They estimate the December unemployment rate “would have been 0.6 percentage point higher than reported” if they changed people’s responses, which they do not do as a matter of long-standing policy.
With that said, the official unemployment rate in December was 6.7 percent, the same as in November.
The number of employed persons rose by only 21,000 and the number of unemployed also rose and by 8,000. However, the size of the entire labor force increased by 31,000 and there were 115,000 more people considered as not in the labor force in December. Historically, these are very small changes in thse numbers.
The labor force participation rate was unchanged at 61.5 percent in December and the employment-to-population ratio was also unchanged at 57.4 percent.
Understandably, the number of discouraged workers is up from a year ago to 661,000 from 277,000 in December 2019.
BTW, we maintain an updated table of many major employment as well as other general economic indicators here or here for the mobile version.


