
![]()
How many people are unemployed? Does anyone know?
Last month we titled our opening analysis as “Has unemployment been misstated? Yes — read on if you want more detail. The title of an article published in the spring 2020 issue of Chicago Booth Magazine, which is the alumni magazine of the University of Chicago Booth School of Business, pretty much confirms what we surmised last month: “U.S. Unemployment Is Even Worse Than the Official Numbers Say.” Click here for the one-page research digest.
It’s a very important question, so this month we look at this subject with different data to try and figure out necessarily what the actual unemployment rate is, but what is the real trend with employment/unemployment
The pandemic has affected the employment-to-population ratio, which normally `varies little from month to month. But in April 2020 it plummeted 8.7 percentage points from the previous month when it rarely varies more than 0.1 percentage point on a sequential basis. Likewise, but not as dramatic, for the civilian labor force participation rate that dropped to 2.5 percentage points in April. Both these metrics have been making gains since then, but still are not quite back to pre-pandemic levels.
The changes in the percentage changes do not necessarily tell what really is happening. The next charts shows the change in the size of the civilian labor force from month to month. Again, pre-pandemic it has been fairly steady — average a change of about 200,000 for the months of May 2019 to February 2020, inclusive, before starting to decline in March and plummeting in April 2020 and starting to rebound in May 2020.
But the question remains about what about those who think of themselves as no longer in the workforce — are they just unemployed and no longer consider themselves as part of the labor force but may return if an opportunity presents itself, or have they left the workforce for good. These data really does not answer that question.
Regardless, it appears that many of people have left the workforce. The exodus began in March 2020 and peaked the next month in April, when many more decided to hang it up and file for a separation from the labor force. However, in the subsequent months of May and June — although many are still leaving the labor force — the rate of exit is moderating, but still much greater than it has been.
July 2020 Employment Report
Quick Recap
As we mentioned last month many states either halted or walked back their reopening plans due to the resurgence of COVID-19 in June and the July employment situation certainly reflects this slowdown.
Regardless, the unemployment rate continue to decrease as the number of unemployed persons decreased as other measurements of employment improved in July but at a slower pace in June as discussed in the Household Survey section below. However, the number of people filing for unemployment benefits last week continued at a high level — for a chart see our Twitter feed.
The economy added a total of 1,763,000 nonfarm jobs in July, which in of itself is a very good number, but pales to the 4,791,000 it added in June and increased by 2,725,000 in May. Not to lose perspective, in April, the economy lost 20,787,000 jobs
After average hourly wages were down by 38 cents an hour in June, likely due to large uptick for lower-paying service jobs coming back that month, hours pay rose 7 cents in July, which is somewhat consistent with the normal trend.
And Temporary help services two-peats with a healthy gain in July that was essentially identical to the June increase.
Job Report
The Bureau of Labor Statistics reports that the economy added 1,462,000 private-sector jobs in July after increasing by 4,737,000 in June and growing by 3,236,000 in May.
The private Goods-producing sector was up only 39,000 in July after adding 515,000 in June and increasing by 676,000 in May.
-
Manufacturing was up 26,000 in July after adding 357,000 in June and increasing 240,000 in May.
-
The Construction sector performed similarly with a gain of only 20,000 in July after growing by 163,000 in June and increasing 456,000 in May.
- But Mining and logging continued to dig itself farther down into a hole with a loss of 7,000 in July after declining 5,000 in June and losing 20,000 in May.
The private Service-providing sector added only 1,423,000 jobs in July, which was roughly only a third of June’s growth of 4,222,000 after adding 2,560,000 in May.
-
The Retail trade sector welcomed back 258,300 jobs in July to greet the 826,900 it added in June.
-
But the Wholesale trade sector reversed direction and declined by 5,300 jobs in July after adding 63,000 in June.
-
Transportation and warehousing added 37,900 in July after increasing by 87,000 in June.
-
Financial activities remained on course with a gain of 21,000 in July that followed an increase of 23,000 in June.
-
The Professional and business services sector increased by only 170,000 in July after adding 318,000 in June. However, declines at Computer systems design and related services continued with a loss of 7,000 in July that followed a decline of 7,200 in June. In contrast, Management and technical consulting services added 4,800 in July after adding 11,300 in June. Architectural and engineering services was flat in July after increasing by 8,900 in June.
-
The private Education and health services sector was up 215,000 in July after adding 567,000 in June. Home health care services continued to recover with historically large gains with an increase 15,600 in July and adding 18,100 in June.
-
Although the Leisure and hospitality sector grew by 592,000 jobs in July, that was certainly a slower rate of growth compared to the 1,981,000 jobs it added in June or even the 1,405,000 it added in May.
The total number of Government jobs was up a total of 301,000 in July. The federal government was up 27,000, state government was up 33,000, and local government was up 241,000. The lion’s share of the increases at both the state and local levels were due to jobs in education.
Temporary Help Services Roundup
As mentioned earlier, Temporary Help Services experienced a two-peat with a gain of 143,700 jobs, which was almost identical to the 143,800 it increased by in June. This brings the total number of THS jobs to 2,382,300, which works out to a 6.4 percent sequential increase, but is still down 18.9 percent from July 2019.
The recent growth in THS can at least be partially attributed to employers shy about adding workers with so much uncertainty ahead. There have been several news reports of this development: here’s one of them.
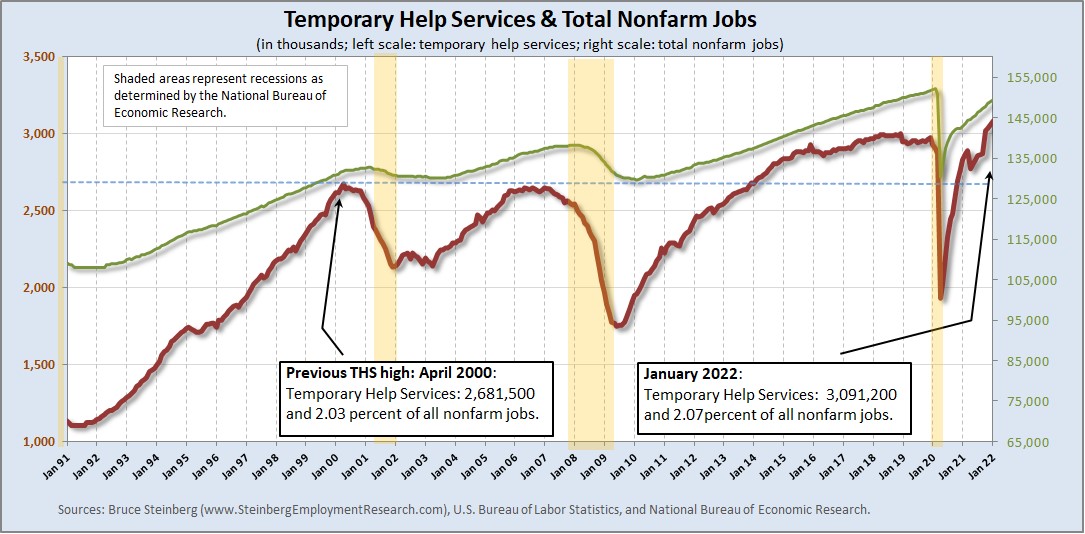
For a chart of temporary help’s growth from January 1991 to July 2020 and comparing its trend to total employment, click here.
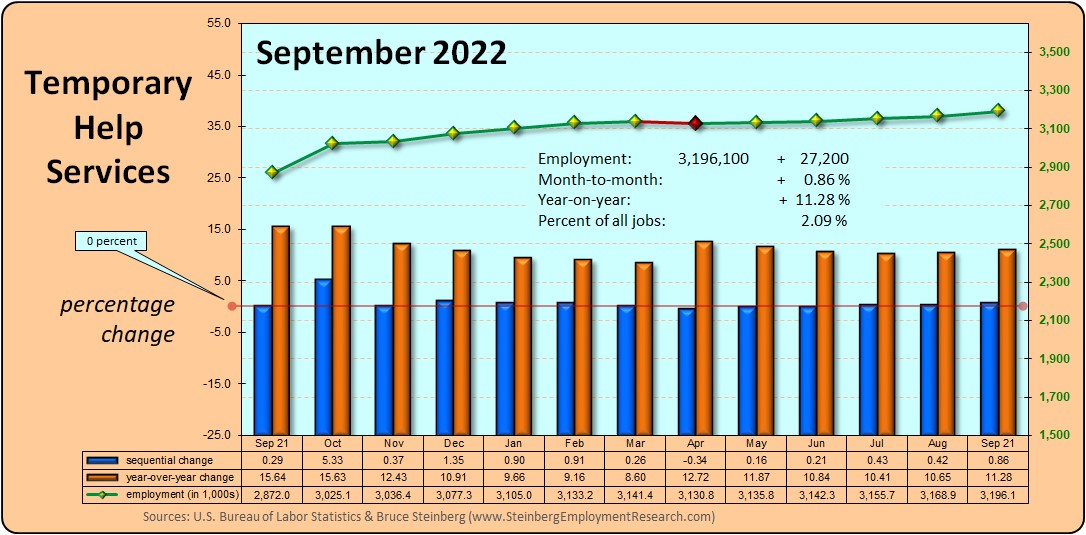
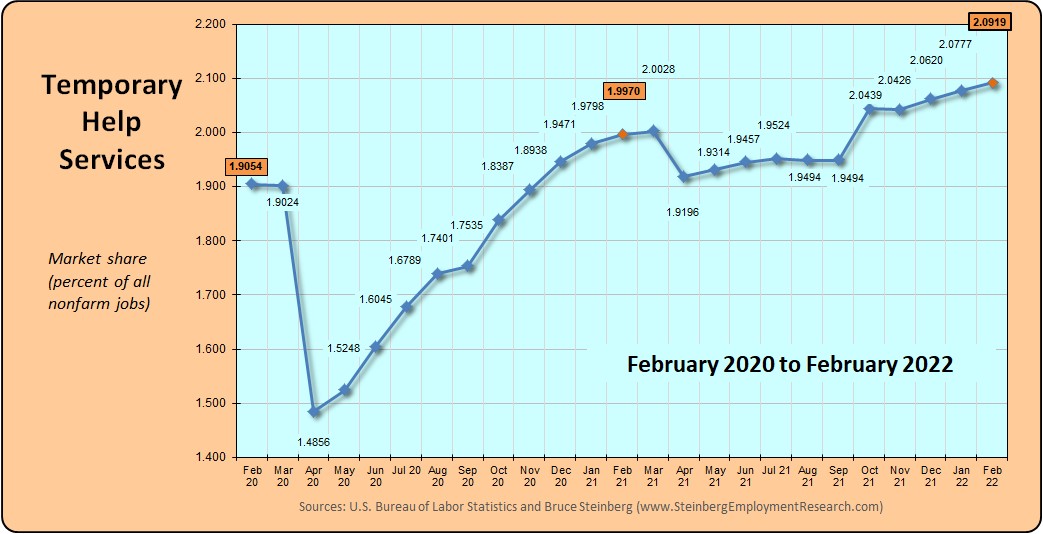
In July 2020, temporary help services market share, which is its portion of all jobs, continue to increase reaching 1.7067 percent. However, a year ago in July 2019 it was 1.9464 percent and two years ago in June 2018 it was 2.0037.
Household Survey
Although BLS continues to report that there are still errors in the data, the situation is improving: “…response that may have been misclassified was much smaller in June and July than in prior months.”
Officially, the unemployment rate in July now is 10.2 percent, an improvement from the 11.1 percent in June, and the 13.3 percent in May.
The number of employed persons increased 1,350,000 in July as the number of unemployed persons declined 1,412,000. The size of the entire labor force shrank by 62,000 and there were 230,000 more people considered as not in the labor force in July.
The labor force participation rate declined 0.1 percentage point to 61.4 in July from June and the employment-to-population ratio was up 0.5 to 55.1 percent; in “normal” times these data rarely change more than 0.1 on a month-over-month basis.
The number of discouraged workers increased considerably from a year ago to 701,000 in July 2020 from 368,000 in July 2019.
BTW, we maintain an updated table of many major employment as well as other general economic indicators here or here for the mobile version.


