
![]()
When, where, and what jobs will come back?
Not to be accused of burying the lead, we don’t know — and doubt if anyone else really does — but there are some clues regarding what will happen to the jobs lost since February and if the growing number of unemployed persons will return to a job, if at all. Note that we only said “return to a job” and not “return to their former job.”
At this time, the big unknown — other than the “when” — is how the pandemic will affect the types of jobs and the possibly opportunities for some new occupations. As America’s economy transitioned from agrarian to industrial to manufacturing to services to one that is information and technology driven today, we may see the pandemic creating a new phase, or possibly a new, ongoing way of accomplishing what had been an established means of doing jobs — a “post-pandemic economy?”.
But, what we do know is that a lot of people are expecting to return to their former jobs (“on temporary layoff”), which proportionally has affected more lower-end service jobs, and we question if those jobs will be coming back at all and / or if workers are disillusioned.
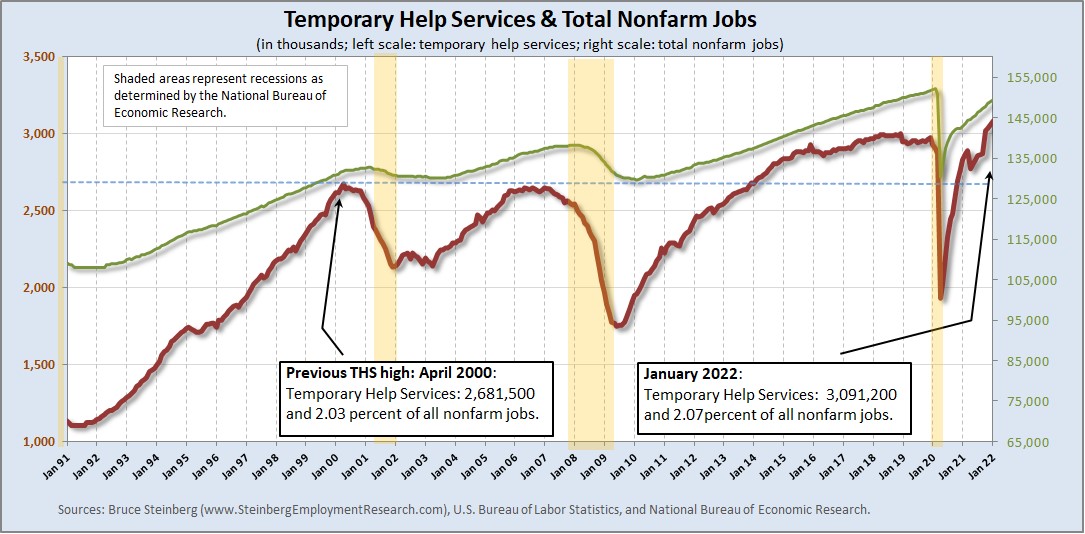
There is always a certain amount of churn in the job market. As the chart shows, the number of people who permanently lost jobs in March 2020 and April 2020 was not too much more than the average from January 2018 to February 2020. BTW, of permanent job losers or those not on a temporary layoff, there is another smaller but related group not charted here of persons who completed temporary jobs, which were not necessarily with staffing services.
Unlike those who permanently lost jobs, there is a striking difference between the average number of people who said they were only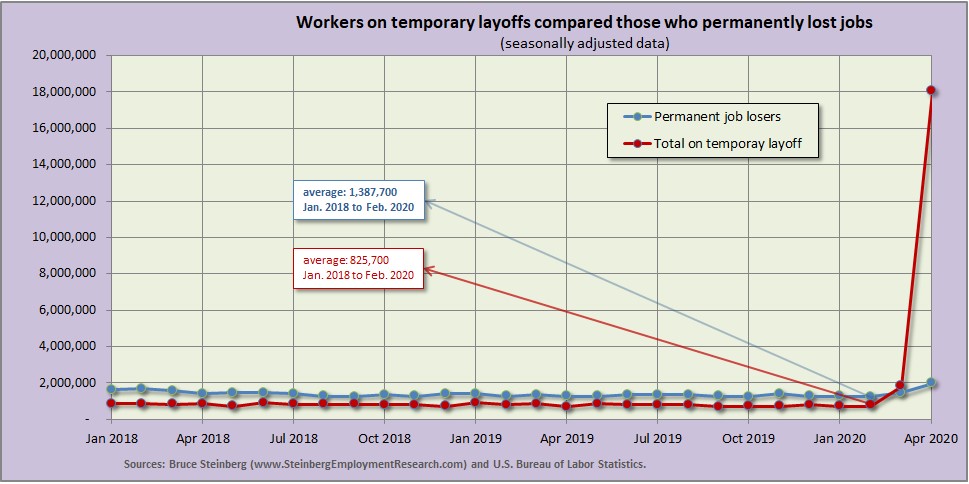 on temporary layoff — often referred to as furloughed workers in the media — from January 2018 to February 2020 that averaged just under 826,000 a month and the past two months of March and April. Keep in mind that first month coronavirus impacted the employment data was March — data are collected for the employment situation in the first half of the month and that was before many major layoffs and just as local officials began to shutdown the economy with stay-at-home orders and non-essential business closures — and there were already almost 1,050,000, or greater than 130 percent, more people on temporary layoffs in March than in February. In April, there were 16,215,000, or 877 percent, more people on temporary layoffs than in March.
But, are these workers really only on temporary layoffs? Obviously, returning to work is contingent on a business to return to — and many businesses may not survive and reopen. Are workers accurately reporting their job prospects or is it wishful thinking that they will be recalled from layoffs? Also, are employers are not being frank by dangling the prospect that furloughed workers will be the first to be rehired when, in fact, employers will use this as a way to eliminate workers whose productivity does not meet the possibly new and reduced level of activity?
It is likely that many of the jobs lost will not be coming back quickly, or even not at all. How will restaurants / movie theatres / amusement parks / etc. adjust their business model in an era of social distancing, which is likely to continue for some time, and subsequent staffing levels and requirements? Will some manufacturers add third shifts — at least, temporarily — by reducing staffing for shifts in order to maintain social distancing / testing requirements in order to maintain output? More specifically, how many contact tracers will be needed and for how long, what skills will they need, who will train them, and who will be paying for them? (Note to staffing companies: could this be an opportunity / a new service line?)
The National Conference of State Legislatures has traditionally reported that 49 states must balance their budgets although that varies depending on the way the requirements are defined. Regardless, since these states must balance their books by year’s end by law, there is going to have to be huge cuts in spending or tax increases to counter the overspending on the pandemic and the decline in tax revenues.
[BTW, the 2020 Census has adjusted its timeline in response to COVID-19, delaying some operations. If there was no pandemic and unemployment remained very low there would be a dearth of qualified workers to conduct some field operations for the necessary follow-up period on the original timeline, but the situation has changed. Better qualified people may be available to conduct some of the now delayed in-person canvassing operations, but it remains if they will be willing to do go out into the community and if people will be willing to literally open their doors to Census enumerators. However, we unofficially hear that the online response to the Census exceeded expectations possibly because people staying at home had the inclination to respond. So while in-person follow-up will start later than originally planned, the total amount of work will be less than anticipated.]
So many questions and so few answers at this time. We’ll leave it to the professional futurists to opine on what that may look like in a modern world that now has experienced a true pandemic, or we’ll look at this at a later time.
Stay healthy — stay strong,
Socially distantly yours,
Bruce
April 2020 Employment Report
Quick Recap
You may have heard by now, but the employment situation in April fell off the cliff [sorry for the slight delay with today’s employment report, but the scales on all of the charts needed major adjustments. — ed.]. As expected, the unemployment rate cratered to 14.7 percent. One bright spot was that the number of discourage workers in April 2020 did not decline as much as some had anticipated, but that is because so many unemployed people expected to be recalled (see our opening analysis above) … see the Household Survey section below for many more details and explanations
If the total number of jobs only fell off the cliff last month with a decline of 870,000 in March, they fell off Mount Everest and declined by 20,500,000 in April. Prior year comparisons are pretty useless at this point. In addition, the estimation method for the establishment survey was changed in an attempt to compensate for the effects of the pandemic on business formation (known as “births”) and permanent closures (unfortunately known as “deaths”), so the reported job numbers could be off.
But, with many states reopening prior to the survey week, these jobs figures will improve when the May 2020 data are released next month as more people will be getting paychecks during the reference week. We will leave it up to you to surmise if that is why many states decided to reopen in early May instead of waiting a couple of extra weeks.
Last month, we said “… it will be interesting to see how the COVID-19 temporary wage boosts will be reflected in these data.” Overall private-sector hourly wages were up 4.67 percent in April, or $1.34 cents, from March. However, the BLS credits “substantial job loss among lower-paid workers” as the reason for the increase with average hourly earnings.
And Temporary help services also fell of the Mount Everest and lost market share with its worse performance since … wait for it … in at least three decades, when tracking through a unique statistical code began.
Jobs Report
Private-sector jobs were down 19,520,000 in April, and in case anyone is wondering, they were down 870,000 in March.
The private Goods-producing sector was down 2,355,000 in April after declining by “only” 74,000 in March
-
Manufacturing was down 1,330,000 in April piled on to a decline of 34,000 in March.
-
Things fell down in the Construction sector with a decline of 975,000 in April that landed on top the 33,000 decrease in March.
- Mining and logging was down 50,000 in April after extracting “only” 7,000 jobs in March.
The private Service-providing sector took a tremendous hit in April — which proved to be minor as we said it would be last month — with a drop of 17,165,000 jobs; it lost 768,000 in March.
-
The Retail trade sector shrank by 2,106,900 jobs in April after a discounting (declining) 44,800 jobs in March.
-
The Wholesale trade sector lost 362,800 jobs in April after declining by only 2,900 in March.
-
Transportation and warehousing shipped out 584,100 jobs in April after also declining by 7,200 in March.
-
Financial activities was down with a loss of 262,000 in April after losing on 3,000 in March.
-
The Professional and business services sector dropped by 2,128,000 jobs in April after losing 69,000 in March. Computer systems design and related services, after adding almost 2,000 jobs in March, deleted 93,200 jobs in April. Management and technical consulting services, after adding 2,600 jobs in March, chopped 78,500 from its payrolls. And Architectural and engineering services, which was only marginally down by 400 jobs in March, erased 85,200 in April.
-
The Education and health services sector was down by 2,544,000 with the losses in many health care and social assistance sub-sectors. Hiring in home health care services, which was revised to show growth of 2,900 in March, was down 93,600 jobs.
-
As expected, the Leisure and hospitality sector really suffered with a loss of 7,653,000 jobs in April after losing “only” 499,000 in March.
The total number of Government jobs was down 980,000 in April. The federal government added 1,000, state government down 180,000, and local government declined by 801,000, partially due to the school closures.
Temporary Help Service Roundup
The number of Temporary Help Services jobs is April was 2,040,000 which was a decline of 841,900 jobs from the previous month, or 29.2 percent. BTW, the sequential decline in the total number of nonfarm jobs 13.52 percent.
The last time THS was at this level was ten years ago in April 2010. Interesting, but only a coincidence.
For a chart of temporary help’s growth from January 1991 to April 2020 and comparing its trend to total employment, click here. Be warned, the chart is pretty shocking.
(if the charts are unclear, click on it to open in a browser window)
In April 2020, temporary help services market share also plunged to 1.5564 percent; the last time it was at this level was also ten years ago April 2010.
Household Survey
Hang on to your hats folks. The number of employed persons declined by 22,369,000 as the number of unemployed persons increased by 15,938,000 and the size of the entire labor force contracted by 6,432,000. And there were 6,570,000 more people considered as not in the labor force in April. And to repeat the bad news, the unemployment rate was 14.7 percent in April compared to only 4.4 percent in March.
The labor force participation rate was declined 2.5 to 60.2 percent in April from March and the employment-to-population ratio was down 9.7 to 51.3 percent; these data rarely change more than 0.1 on a month-over-month basis.
However, the number of discouraged workers did not skyrocket, but did increase from 454,000 in April 2019 to 585,000 in April 2020.
BTW, we maintain an updated table of many major employment as well as other general economic indicators here or here for the mobile version.


