
![]()
In Bruce Steinberg’s February employment report, he explores how an already tight employment market is reacting to COVID-19 when unemployment rates remain at a historically low percentage.
The February employment report has detailed updates on job trends in all sectors. Send it to your staffing colleagues to keep your team up to date:
February 2020 Employment Report
As written by Bruce Steinberg:
The unemployment rate remained at its historical low of 3.5 percent in February 2020. The number of employed persons increased, the number of unemployed persons decreased as the labor force contracted … see the Household Survey section below for more details and explanations.
The total number of jobs increased 273,000 in February, which coincidentally was the same amount of job growth the previous month; a year ago in February 2019, overall jobs increased only 1,000.
Overall private-sector hourly wages were up 0.32 percent in February, or nine cents, from January and up 3.0 percent, or 83 cents, from February 2020; the sequential gain was a bit more than the past few months and the annual change was slightly less.
And Temporary help services declined in February at a slightly faster pace than in January; THS have declined in nine of the past 13 months.
Jobs Report
Private-sector jobs were up 228,000 in February, which was slightly better than January’s increase of 222,000.
The private Goods-producing sector was up 61,000 in February compared to a gain of 27,000 in January; a year ago in February 2019, it was down 29,000.
-
Manufacturing reversed direction and was up 15,000 in February compared to a reported decline of 20,000 in January.
-
Apparently, the Construction sector is really in the business of building jobs. It added 42,000 jobs in February after increasing by 49,000 in January; a year ago in February 2019, it declined by 29,000.
- Mining and logging was up 4,000 in February after burying (declining) 2,000 jobs in January; a year ago in February 2019, it was down 5,000.
The private Service-providing sector increased by 167,000 jobs in February, which was less than the 195,000 it gained in January; a year ago in February 2019, it increased by only 23,000.
-
The Retail trade sector shrank by 7,000 jobs in February on top of experiencing a loss of 5,800 in January; however, a year ago in February 2019, it declined by much more with a decline of 29,300 jobs.
-
The Wholesale trade sector was down 2,600 jobs in February after adding 5,600 in January; a year ago in February 2019, it was up 5,800 jobs.
-
The Transportation and warehousing sector slammed into reverse with a decline of 4,000 in February after adding 29,800 in January; a year ago in February 2019, it increased by only 1,600.
-
Financial activities added 26,000 jobs in February and that was more than the 10,000 it added in January; a year ago in February 2019, it increased by 14,000 jobs.
-
The Professional and business services sector experienced growth of 41,000 in February and that was more than the 25,000 it gained in January; a year ago in February 2019, it was up 38,000. Computer systems design and related services was up 7,800 in February. Management and technical consulting services was up 2,500 and Architectural and engineering services was up 10,300.
-
The Education and health services sector added 54,000 jobs in February that was less than the 72,000 it increased by in January, but all of this major sector’s job growth was in its health care and social assistance component and then some. Hiring in home health care services continued by adding 9,700 in February, which was more than double the 4,300 it increased in January.
-
The Leisure and hospitality sector added 51,000 jobs in February that followed a gain of 38,000 in January; a year ago in February 2019, it was down 23,000.
The total number of Government jobs was up 45,000 in February. The federal government added 8,000, state government up 18,000, and local government added 19,000.
Temporary Help Services Roundup
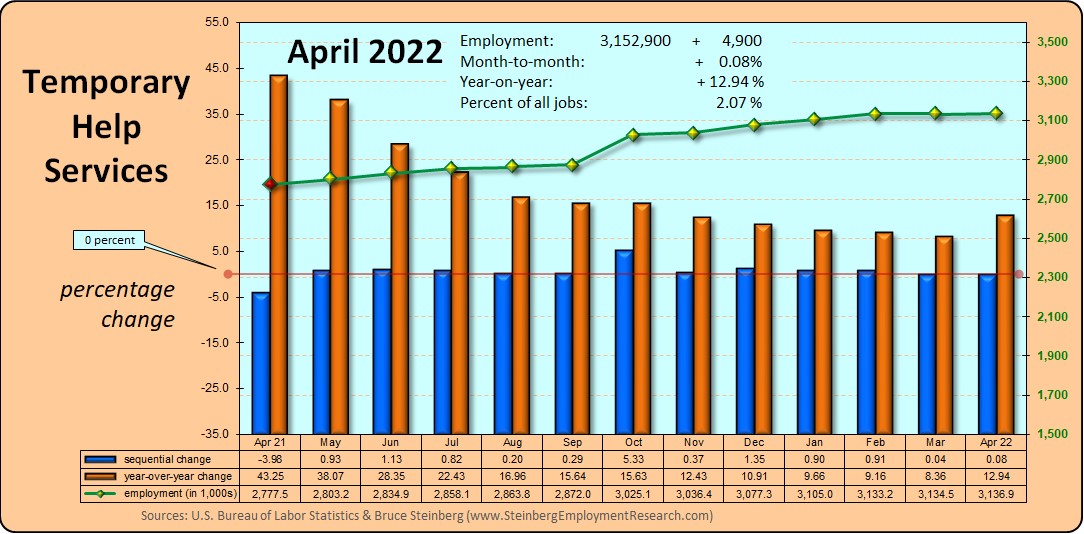
The number of temporary help jobs in December was 3,043,300 and that works out to a 6,400 gain and a 0.2 percent increase from November but a 0.5 percent year-over-year decline. Interestingly, October was initially reported as a decline, then revised to an increase last month, and now is being reported as a decline again.
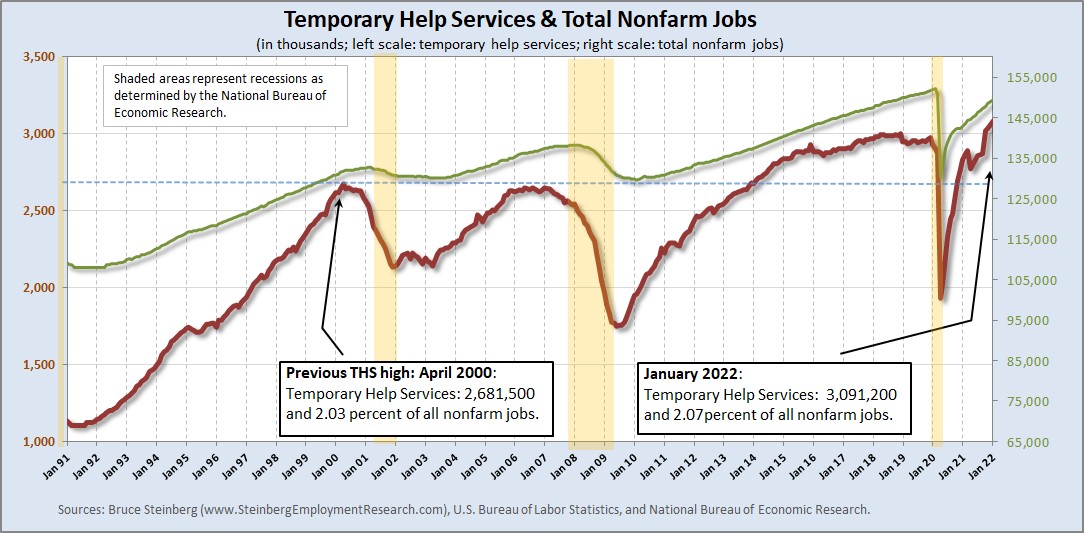
For a chart of temporary help’s growth from January 1991 to December 2019 and comparing its trend to total employment, click here.
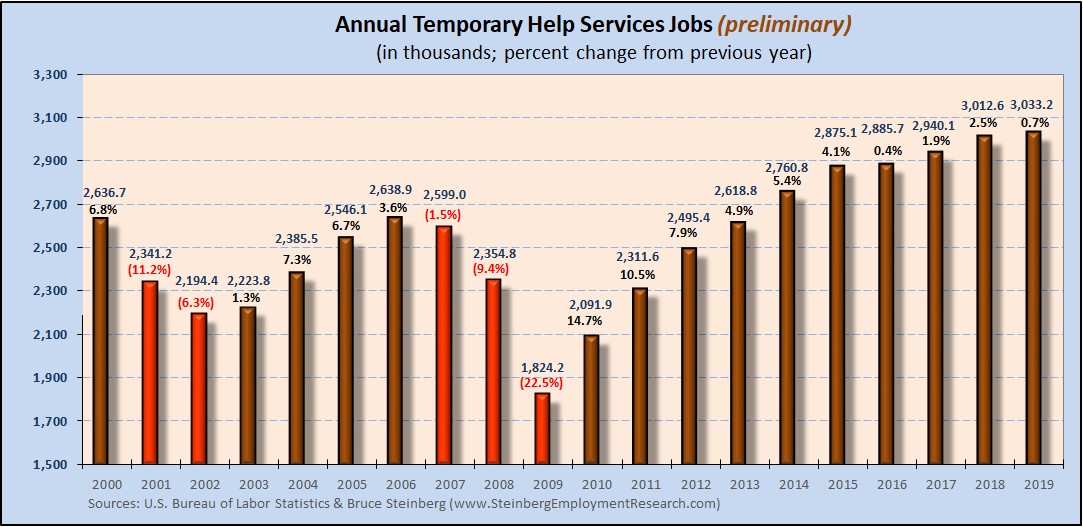
Although monthly data will not be finalized until next month, below is the annual change for temporary help services from 2000 to 2019 based on the preliminary information.
Based on currently published information, which will be revised next month with the publication of the January 2020 data, temporary help services was able to eke out a positive performance for 2019 on an annual basis by expanding 0.7 percent compared to an increase of 2.5 percent in 2018 from 2017.
In December 2019 temporary help services regained a some market share of all jobs to 1.9971 percent but is still well below a year ago in December 2018, when it was 2.0361 percent, and two years ago in December 2017, when it was 2.0167 percent.

Household Survey
The unemployment rate edged down to remain at a 50-year low of 3.5 percent in February.
The number of employed persons increased by only 45,0000 as the number of unemployed persons declined by 105,000 at the same time the size of the entire labor force contracted by 60,000. And there were 186,000 more people considered as not in the labor force in February. In other words, although the size of the entire labor force increased by slightly more than the increase in the number of employed persons, the number of unemployed persons declined enough to move the unemployment rate needle lower.
The labor force participation rate was unchanged at 63.4 percent in February but the employment-to-population ratio was edged down at 61.1 percent from the previous month.
BTW, we maintain an updated table of many major employment as well as other general economic indicators here or here for the mobile version.


